highcharts 柱状图问题
用highcharts 做柱状图时,要在每个柱状图中间显示柱状图的名称,也就是显示series.data.name的值。该怎么做?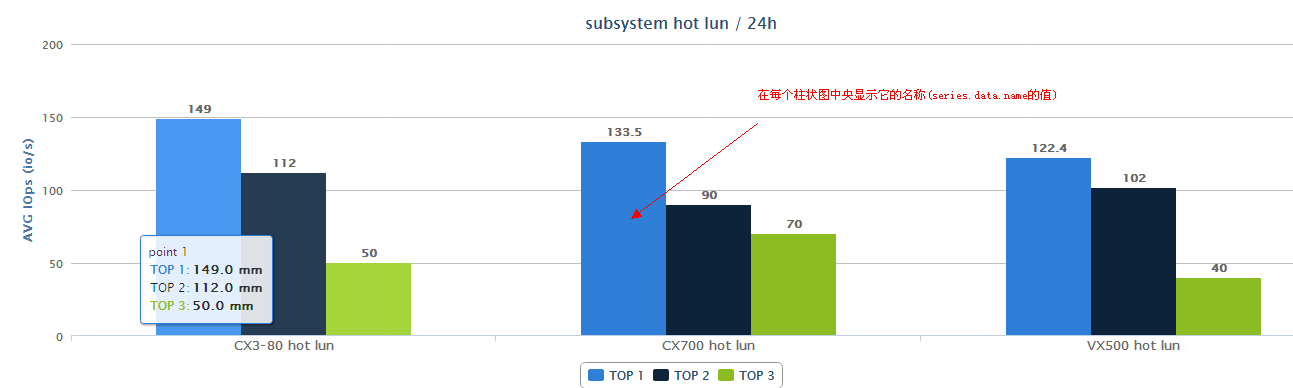
代码如下:
$(function () {

        $('#container').highcharts({

            chart: {

                type: 'column'

            },

            title: {

                text: 'subsystem hot lun  / 24h'

            },

            xAxis: {

                categories: [

                    'CX3-80 hot lun',

                    'CX700 hot lun',

                    'VX500 hot lun',

                ],

                labels: {

                    style: {

                        fontSize: '13px',

                        fontFamily: 'Verdana, sans-serif'

                    }

                },

				formatter: function(){

					return this.value;

				}


            },

            yAxis: {

                min: 0,

                title: {

                    text: 'AVG IOps (io/s)'

                },

                stackLabels: {

                    enabled: true,

                    style: {

                        fontWeight: 'bold',

                        color: (Highcharts.theme && Highcharts.theme.textColor) || 'gray'

                    }

                }

            },

            tooltip: {

                headerFormat: '<span style="font-size:10px">{point.key}</span><table>',

                pointFormat: '<tr><td style="color:{series.color};padding:0">{series.name}: </td>' +

                    '<td style="padding:0"><b>{point.y:.1f} mm</b></td></tr>',

                footerFormat: '</table>',

                shared: true,

                useHTML: true

            },

            plotOptions: {

                column: {

					cursor: 'pointer',

                    pointPadding: 0,

                    borderWidth: 0,

					dataLabels: {

							enabled: true,

							style: {

								fontWeight: 'bold'

							},

							formatter: function() {

								return this.y;

							}

					}

                }

            },

            series: [{

                name: 'TOP 1',

				data:[{

					name:'point 1',

					y:149

				},{

					name:'point 2',

					y:133.5

				},{

					name:'point 3',

					y:122.4

				}]


            }, {

                name: 'TOP 2',

                data: [{

					name:'point 4',

					y:112

				},{

					name:'point 5',

					y:90

				},{

					name:'point 6',

					y:102

				}]


            }, {

                name: 'TOP 3',

                data: [{

					name:'point 7',

					y:50

				},{

					name:'point 8',

					y:70

				},{

					name:'point 9',

					y:40

				}]


            }]

        });

    });
求大神指教 JavaScript highcharts --------------------编程问答--------------------
 --------------------编程问答--------------------
formatter: function() {
--------------------编程问答--------------------
formatter: function() {return this.name + ':' +this.y;
}
--------------------编程问答--------------------
是在哪里加?
 plotOptions: {

                column: {

                    cursor: 'pointer',

                    pointPadding: 0,

                    borderWidth: 0,

                    dataLabels: {

                            enabled: true,

                            style: {

                                fontWeight: 'bold'

                            },

                            formatter: function() {

                                return this.name+":"+this.y;

                            }

                    }

                }

            },
加了以后都是this.name都显示undefined. --------------------编程问答-------------------- plotOptions: {
column: {
cursor: 'pointer',
pointPadding: 0,
borderWidth: 0,
dataLabels: {
enabled: true,
style: {
fontWeight: 'bold'
},
formatter: function() {
<span style="color: #FF0000;"> return this.name+":"+this.y;</span>
}
}
}
},
在plotOptions加了以后都是this.name都显示undefined. --------------------编程问答-------------------- plotOptions: {
column: {
cursor: 'pointer',
pointPadding: 0,
borderWidth: 0,
dataLabels: {
enabled: true,
style: {
fontWeight: 'bold'
},
formatter: function() {
return this.name+":"+this.y;
}
}
}
},
在plotOptions加了以后都是this.name都显示undefined. --------------------编程问答-------------------- 建议看着demo里面的格式,生成数据,改写js
补充:Java , Web 开发