Matlab 验证 部分样本空间 可以预测 其总体样本的性质
主验证程序的总体思想是:
1 随机产生大量的服从指数分布的随机数;
2 随机挑选出部分点的值,分别计算它们的理论平均值与真实平均值;
3 得到实验结果,画图,比较分析。
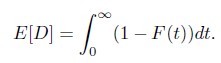
计算大量数据的平均值时,可以用期望等于其样本空间上对(1-CDF)的积分计算,shown as follows:
首先是验证程序:
[plain]
clear;
% --- Control message
CNT_Selected_Pnts = 20;
% ------------------- Not manually controlled.
meanVal = 100;
CNT_numbers = 10000;
% 1 Create serval rdm numbers following a certain model.
rdmNumbers = exprnd(meanVal, CNT_numbers, 1);
% 2 Calculate the CDF of the unmbers
min_x = min(rdmNumbers)
max_x = max(rdmNumbers)
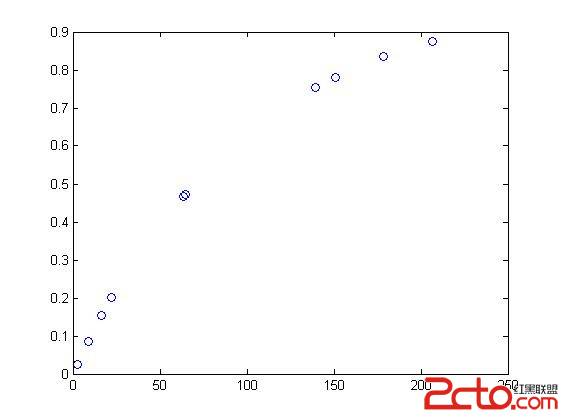
[x,cdf_x] = funcCDF_rdm(CNT_Selected_Pnts, min_x, max_x, rdmNumbers);
plot(x, cdf_x, 'ob')
%plot(cdfNs)
% -Calculate the avgVal_ana
JF_Func = 1 - cdf_x;
AvgVal_ana = trapz(x, JF_Func)
% -Calculate the avgVal_true
AvgVal_true_lib = mean(x)
其中用到一个辅助函数 -- FuncCDF_rdm(...),其作用是随机挑选出若干个Points,并计算出在这些点处的 CDF 值,最后返回。
[plain]
% ----
% para@1: CNT_pnts, the number of points to denote the CDF;
% para@2: Range_low, the lower bound of variable;
% para@3: Range_up, the upper bound of variable;
% para@4: arr_Vals, array of the values to be dealed with.
% ----
% Return@ x : the array of selected Pnts-value.
% Return@ CDF_Vals : the array of selected Pnts' CDF_values.
% ----
function [x, CDF_Vals] = funcCDF_rdm(CNT_pnts, Range_low, Range_up, arr_Vals)
% -- 1 Prepare the original data
data = sort( arr_Vals' ); % T', turn horizon arrays of T.
sumPnts = length(data);
Counter_every_pnt = zeros(1,CNT_pnts);
% -- 2 Count appearance times of every point
% -- 2.1_Select the random points from the original data.
idxs_rdm = randperm(sumPnts);
idx_selected = idxs_rdm(1:CNT_pnts); % !! Take the former CNT_pnts random numbers.
idx_selected = sort( idx_selected ); % !! Must be sorted.
Selected_data = data(idx_selected);
% -- 2.2_Calculate the counter between every two selected adjacent points.
for i = 1:1:sumPnts
for selected_id = 1:1:CNT_pnts
Current_selected_pntVal = Selected_data(selected_id);
if ( data(1,i) <= (Range_low + Current_selected_pntVal) )
Counter_every_pnt(1,selected_id) = Counter_every_pnt(1,selected_id) + 1; %--Inc 1 of the counter.
end
end
end
% -- 4 calculate the CDF_val of every point.
CDF = Counter_every_pnt(1,:)./sumPnts;
% -- 5 return the Ret-values
x = Selected_data;
CDF_Vals = CDF';
然后是实验结果:
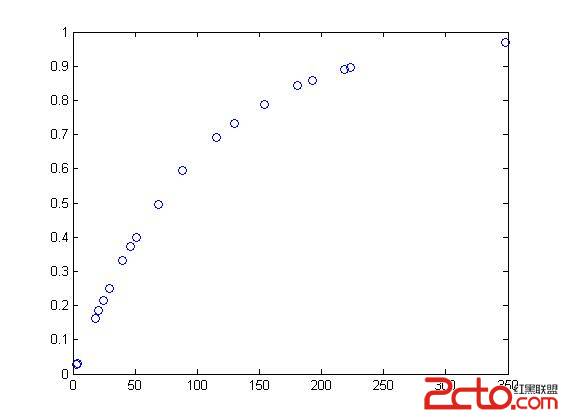
1. CNT_Selected_Pnts = 10 时
min_x = 0.0208
max_x = 810.8252
AvgVal_ana = 86.5878
AvgVal_true_lib = 85.4083
2. CNT_Selected_Pnts = 20 时
AvgVal_ana = 94.2869
AvgVal_true_lib = 97.8661
3. CNT_Selected_Pnts = 200 时
AvgVal_ana = 98.9270
AvgVal_true_lib = 102.1692

4. CNT_Selected_Pnts = 1000 时
AvgVal_ana = 99.0635
AvgVal_true_lib = 100.2150
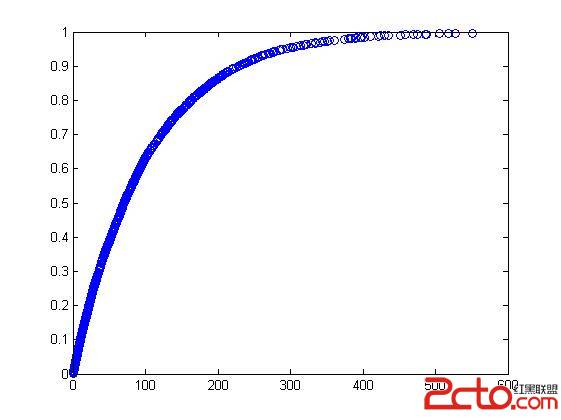
结论:
1 当所选取的节点的数目越多时,理论值与实验值就越接近真实的平均值。
2 用部分样本空间可以预测出服从指数分布的大量数的总体样本空间的平均值。
补充:综合编程 , 其他综合 ,