程序员绘图利器 — Graphviz
Graphviz (Graph Visualization Software) 是一个由AT&T实验室启动的开源工具包。DOT是一种图形描述语言,非常简单的,
Graphviz就是用来处理这种语言的工具。只需要简单了解一下DOT语言,就可以用Graphviz绘图了,它对程序员特别有用。
So in short, if you are a programmer, it is born for you。
无向图
[java]
graph graphname {
a -- b -- c;
b -- d;
}

有向图
[java]
digraph graphname {
a -> b -> c;
b -> d;
}

属性
[java]
//DOT语言中,可以对节点和边添加不同的属性。
digraph graphname {
//节点的属性,节点的名称
a [lable = "Foo"];
//节点的属性,节点的形状
b [shape = box];
//边的属性,边的颜色
a -> b -> c [color = blue];
//边的属性,边的线状
b -> d [style = dotted];
}
基本图形
[java]
digraph G {
//把图片的尺寸设为4inch * 4inch
size = "4,4";
main [shape = box];
//边的重要程度,默认是1
main->parse [weight = 8];
parse->execute;
//点状线
main->init[style = dotted];
main->cleanup;
//连接了两条线
execute->{make_string;printf}
init->make_string;
//把边的默认颜色设为red
edge [color = red];
main->printf [sytle=bold, label = "100times"];
//节点的名称
make_string [label = "make a\nstring"];
//设置节点的默认属性
node [shape=box,style =filled,color=lightgrey];
execute->compare;
}

多边形
[java]
digraph G{
a -> b -> c;
b -> d;
/* 形状为多边形,边数为5,外框为3条,颜色为淡蓝,样式为填充 */
a [shape = polygon, sides = 5, peripheries = 3, color = lightblue, style = filled];
/* 形状为多边形,边数为4,角的倾斜度为0.4,内容为hellow world*/
c [shape = polygon, sides = 4, skew = 0.4, label = "hello world"];
/* 形状为倒三角,整体旋转30度 */
d [shape = invtriangle,orientation = 30];
/* 形状为多边形,边数为4,扭曲度为0.7 */
e [shape = polygon, sides = 4, distortion = 0.7];
}

数据结构
(1)复杂的标签
[java]
digraph structs {
/* 把节点的默认形状设为矩形record,默认的是圆角矩形Mrecord */
node [shape = record];
struct1 [label = "left|middle|right"];
struct2 [label = "one|two"];
struct3 [label = "hello\nworld|{b|{c|d|e}|f}|g|h"];
struct1 -> struct2;
struct1 -> struct3;
}

[java]
graph picture {
//这幅图的名字
label = "I love you";
//图名字的位置在bottom,也可以是t
labelloc = b;
//图名字的位置在left,也可以是r
labeljust = l;
edge[decorate = true];
C -- D [label = "s1"];
C -- E [label = "s2"];
C -- F [label = "s3"];
D -- E [label = "s4"];
D -- F [label = "s5"];
edge[decorate = false, labelfontcolor = blue, fontcolor = red];
C1 -- D1 [headlabel = "c1",taillabel = "d1",label = "c1 - d1"];
}

(2)行列对齐
[java]
digraph html {
rankdir = LR;
{
node[shape = plaintext];
1995 -> 1996 -> 1997 -> 1998 -> 1999 -> 2000 -> 2001;
}
{
node[shape = box, style = filled];
WAR3 -> Xhero -> Footman -> DOTA:
WAR3 -> Battleship;
}
{rank = same; 1996; WAR3;}
{rank = same; 1998; Xhero; Battleship;}
{rank = same; 1999; Footman;}
{rank = same; 2001; DOTA;}
}

(3)二叉树
[java]
digraph G {
label = "Binary search tree";
node [shape = record];
A [label = "<f0>|<f1>A|<f2>"];
B [label = "<f0>|<f1>B|<f2>"];
C [label = "<f0>|<f1>C|<f2>"];
D [label = "<f0>|<f1>D|<f2>"];
E [label = "<f0>|<f1>E|<f2>"];
F [label = "<f0>|<f1>F|<f2>"];
G [label = "<f0>|<f1>G|<f2>"];
A:f0 -> B:f1;
A:f2 -> C:f1;
B:f0 -> D:f1;
B:f2 -> E:f1;
C:f0 -> F:f1;
C:f2 -> G:f1;
}

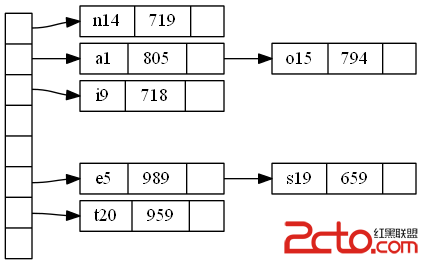
(4)哈希表
[java]
digraph G{
nodesep = .05;
rankdir = LR;
node [shape = record,width = .1,height = .1];
node0 [label = "<f0>|<f1>|<f2>|<f3>|<f4>|<f5>|<f6>|",height = 2.5];
node [width = 1.5];
node1 [label = "{<n>n14|719|<p>}"];
node2 [label = "{<n>a1|805|<p>}"];
node3 [label = "{<n>i9|718|<p>}"];
node4 [label = "{<n>e5|989|<p>}"];
node5 [label = "{<n>t20|959|<p>}"];
node6 [label = "{<n>o15|794|<p>}"];
node7 [label = "{<n>s19|659|<p>}"];
node0:f0 -> node1:n;
node0:f1 -> node2:n;
node0:f2 -> node3:n;
node0:f5 -> node4:n;
node0:f6 -> node5:n;
node2:p -> node6:n;
node4:p -> node7:n;
}
流程图
[java]
digraph G{
subgraph cluster0 {
node [style = filled,color = white];
style = filled;
color = lightgrey;
a0 -> a1 -> a2 -> a3;
label = "process #1";
}
subgraph cluster1 {
node [style = filled];
b0 -> b1 -> b2 -> b3;
label = "process #2";
color = blue;
}


